The answer to that question is: you decide.
Adobe’s consulting group will tell you to place the tracking code as closely as possible to the closing </body> tag. Down there, you first load the JS file that does all the setup (s_code.js), then you’ll add a <script> block that allows you to assign a name to the page. Finally, still within that <script> block, you’ll call the s.t() method, which sends off the image request.
It’s up to you where you place the loading of the JS file, the assignments and the s.t() call, of course. (Be aware though that the JS file should not be loaded in the <head> of the page because it does some manipulation of the DOM when it’s loaded.)
So there we have it: The Page Views metric is incremented when you call s.t(), or to be more specific: when the Adobe Analytics collection servers have received the image request built and sent by calling s.t().
Most web analytics tools build two different types of reports with the Page Views metric: a trended report that shows how the metric develops over time, and ranked reports that allow the marketer to judge which parts of the site attract attention.
A trended report might look like this:

Whether such a report is meaningful or not shall not be a topic here.
A ranked report might look like this:
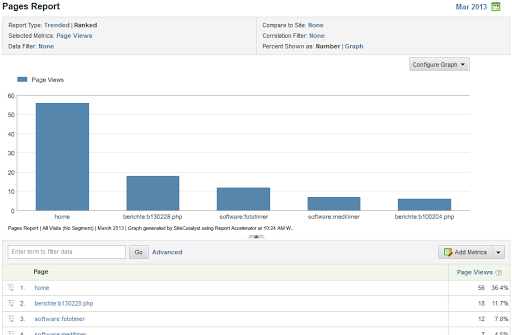
This report splits the Page Views by name of page that has been loaded. As a result, the marketer can judge which pages are the most popular ones.

3 thoughts on “Page Views”