This is a guest post from @ursboller (Rockstar tip Adobe Summit EMEA 2019)
Ever since I worked with adobe workspace there has been one big challenge: the documentation of the implementation needs to be up to date. Not only for you as analyst but also for everybody else using the data it is crucial to know which dimensions (props/eVars) and metrics (events) can be used within any project. And the more you open Adobe Analytics for public by giving direct access to all business users the need for a proper setup rises.
There have been some great blog posts and ideas about how you can do a documentation on your Adobe Analytics Implementation: Adam Greco found an amazing way to upload the documentation to Adobe Analytics and using Workspace to create fancy reportings (Part 1, Part 2, Part 3 and Part 4). And Jenn Kunz even created an SRD App.
All those ideas are great and make live a little bit easier, but both lack of two problems: time and work. First you need a lot of time to setup the documentation (especially if you want it directly in Adobe Workspace like Adam showed in the blog posts). And second, you need to find a way to split your documentation to match the different business users needs. While keeping the documentation up to date is just a matter of work art, the last point made me think a lot in the past years.
Challenge: I want a solution that shows every business users the items they can use when analyzing data. Goal too high? Maybe yes, but sometimes you find a great solution – and that’s why you read this blog post.
Analytics documentation in Adobe Workspace
While this might sound like the solution Adam wrote in his blog post (and which gave me inspirationto use Adobe Analytics Workspace), I came up with a completely new way to create and show the documentation. The idea is to have one single table which can be added to any workspace project. Within this single table and without further modification from the user it will show the data than can be used for your project.
Maybe it’s easier to have a simple example: imagine you have a website with a landing page, some products to sell and a checkout process. On your site you’re just collection a few data points like page names, some information about the products and you have some events to measure the success. In the following picture you can see the table when you apply a hit-segment for the landing page, for the product page as well as the purchase event:

Isn’t that great? If you apply a hit-segment to the table, the table only shows the items (props/eVars/events) that have been set on the corresponding analytics server call. And only those are the dimensions and metrics you can use for investigation about user behavior.
While this is really a simple example and in real life you have a lot more of data you have on each server call (and therefore in your table) it should at least give you a quick insight how it might look like.
Behind the scene 1: listProps
Let’s have a look how it works to get such a table. Basically you need a way to report on each server call, which dimensions (props/eVars) and metrics (events) have been sent to Adobe Analytics. Maybe you already knew that to get the tables above, I use a “listProp” to get the single items of a long string split up in a way to report like above. In case you never used listProp, I will explain a little bit what exactly happens between data collection and reporting.
Remember the example above with the simple website and inspect the tracking call for the landing page. You would see something like this:
pageName: landing page
events: event1
v1: English
Now let’s add a new prop (prop1) to the server call. The call would like this:
pageName: landing page
events: event1
v1: English
c1: Pagename,Page view,Language
And finally you need to enable the settings in your report suite the new listProp (prop 1) to catch the documentation:

That’s all! Now, whenever the tracking for the landing page fires, the new data is sent to Adobe Analytics. The data in our listProp will be split by the desired delimiter and you can use it for reporting right away:

As you can see the text in the server call is split up by the selected delimiter and each item appears as single line in reporting. The more data you have in your project, the more events and items will appear and show you the dimensions and metrics you can use.
Basically we could finish here: just add another string to your analytics implementation and you’re ready to go. But wait, we have two problems:
- Rules stacking: May you have more than one rule which sets the props/eVars/events. We need a way to get all information just before the “sent beacon action” (to be as close as possible to the final data collection)
- Long strings: Your final string could get too long. If you write just a few items, it looks ok, but maybe after 5 or 10 short names you would extend the limit of 100 chars. Remark: a listProp has the same limit as a regular prop for the full string, not for the single items!
While the first point problem can be solved by your tag manager (DTM/Launch, see “Step 1” below), the second one is really tricky to solve.
Behind the scenes 2: items coding system
As already mentioned, you have only 100 chars in total to send to a listProp. And don’t forget, that each item needs a delimiter too. When I first tryied an implementation, I just took the item names similar to the “s.linkTrackVars” and “s.linkTrackEvents” string and put it into the new listProp. The example from above would look like this:
pageName: landing page
events: event1
v1: English
c1: pageName,event1,eVar1
While this is already a little bit shorter, it is still too long to suit most of my use cases. If I think of events higher than 100, I would extend the length when I have about 10 single items. And looking at a real landing page I could see at least 10 to 20 eVars and events set on a single hit.
You could still shorten the string and leave out those characters not really needed, just by giving each eVar a “v”, the props a “p” and “e” for events. The new string in the example hit would now look like:
pageName: landing page
events: event1
v1: English
c1: pn,e1,v1
Ok, far better! We really shortened the string to about 2 characters, if I have events over 100 this would be a max of 5 characters for each item (1 char for letter, max 3 for the number and 1 for the delimiter). That means I can have at least 20 codes in my string, just doubled the result from before. But lets have a look if we could make it even better and collect more.
To understand the final solution, we need to talk about how many characters we need to uniquely identify an item. If we use the shortened names from above the numbers still stick to be long. For example event500 would still need at least 5 characters (“e500,”). the reason is, that each character for the numbers is limited to 10 numbers (0 to 9). But: we are not limited to numbers, we could also take letters or any other character (maybe not all, since special characters might break the whole tracking).
For the final solution I decided to create a new “base-64” coding system, taking all numbers 0-9, all letters (a-z AND A-Z) and two save special characters “-_”
Those are my 64 characters I can use to create codes. Lets have a look at the difference between the first items of the coding table. The first line shows the numbers 0 to 63 and the second line the “base-64-code” for the same numbers:

That means, just by using 1 single character, I can define 64 different items. And with just 2 characters, I can define a total of 4096 (=64*64) different items! And the best: I need at max 3 characters (2 for the code, 1 for the delimeter) to define every item of my call. This will end up in a new minimum of 33 single items in each call! That should be enough to cover most use cases, or do you have any analytic calls where you set more than 33 props/eVars/events? (Remark: just in case you have, you could split dimension and events to two different listProps, not add those props just for quality purpose or …)
How does this look like in our example call? Instead of sending a real name (or shortened name) of the variable, I need to match it against my code table and add it to the call. The new hit would look like this:
pageName: landing page
events: event1
v1: English
c1: 6G,7r,1
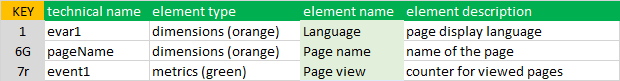
The codes used are just the corresponding values in my table: pageName was defined as item 400 and therefore has code “6G”, event1 is item 501 and code “7r” and eVar1 has Code “1”. The following image shows how the number and codes are defined:

That means we start with the eVars (1-225), next props (301-375), some special vars like pagename, channel, products as well as special events (up from 400), and finally all events (501 to 1500)
To make it easier for you, please find an excel sheet with all codes and the corresponding variable/events here: “Excel with docu-codes mapping, v1.0“
Step 1: Update your tag manager (DTM/Launch)
I need to thank Jan Exner and Benedikt Wedenik from Adobe Consulting to help setting up all the code for our private extension. But since I can not provide the private extension here, I will just show the part of the code needed to get it up and running.
There are just two simple steps to add the code to your Adobe Analytics implementation (both DTM and Launch): You need to define a new function which then can be called from within “s.doPlugins”.
The function “writeAADocuString”
The new function just does everything for you when called by s.doPlugins. Basically the function consists of two parts: First, it creates a new object in “_satellite” where it stores all the codes. This object used for a faster lookup later on and is done only once per pageload. Second, just before every analytics call, the function inspects the data and creates the “string” for your documentation.
Install the function and do the configuration
Open the file “writeAADocuString.js” (file on github) and copy the code into the “custom code” of your Adobe Analytics implemenation.
The configuration is in the first lines of the function where you define the listProp (and an overflow listProp if you want) as well as the length of the string (in case you want to use a listVar). and finally, replace the string “your_company” by a js-friendly company name (this is used to store the code lookup map in the object “_satellite.your_company.varsMap”)
Call the new function in “s.doPlugins”
The new function needs to be called each time just before an Analytics call is sent to Adobe. This can be done by calling the function within a custom “doPlugins”. A simple example to use the new function within s_doPlugins would look like this:
// Define function for documentation (code in file above)
var writeAADocuString = function (s) { ... }

// Enable plugins
s.usePlugins = true;

function s_doPlugins(s) {
    // Do your custom stuff here

    // Call the quality stats function at the end!
    writeAADocuString(s);
}
// Set plugins function
s.doPlugins = s_doPlugins;
Test the new string in the analytics call
After you added the code above to your Analytics Files it’s time for testing (and please do it to check the behavior on your page! not every code works in all environments, so please do check your page before publishing the changes!)
Easy decoding the docu string
In the excel file above I added a second sheet for an easy “decoding” of the new string. Just copy the whole string from the server call and let excel show you what is in there.
Bonus: use “processing rules” to add data
There are some use cases where you either don’t have any DTM/Launch installed (eg. Mobile Apps) or where you set your props/eVars/events in the processing rules. If you have some cases like this you can add another “base-64-code” to the documentation string:

Every time the rule gets triggered, this block will add the desired “code” at the end of the documentation string. In the picture the code “1” would be appended at the end of the documentation string like “[existing string],1”. In fact, you could even set more codes just by adding those in the field using the same delimiter (like “1,2,3,4” to set eVars 1 to 4).
Attention: If you add too much items to the string it might get longer than 100 chars! and worst case, it would “slice” the string just after the first character of a new code, which stands for another item. Example: if you have the code “2W” (eVar160) at around character 100, it might slice and keep just the “2” at the end (equals eVar2). This would result in a wrong “documentation” since you don’t get the right items in the listProp. So please make sure you do not add to much to not run into this problem!
Step 2: Setup listProp with classification
Now you are ready to go and send data to Adobe Analytics. Once the code is published, each hit contains a string with the codes. Next, you need to add a classification which allows you to set the context data to each single items of the listProp. Here is an example how the classification could look like

And your classification file for the simple example above would look like this (shortened to fit for publishing)
To make the classification very easy for you, just use the file
“Excel with docu-codes mapping, v1.0” and copy the rows to a template classification file.
Step 3: create tables for reporting
After publishingthe code in your Analytics property and uploading the classification file, you can now start creating tables for your reports. Basically, it is the single table I showed at the beginning, no further adoption is needed. Just add the new table to any project and you can see what data flows in and can be used (since the code is on the hit, we expect that there is data on the corresponding variable or the event is set). Just have a look at our example for the simple hit:

But wait, it might not be as easy as it looks here. Most likely you have more than just the 3 items on the single hit and you might have more than one hit in your project. Therefore the table might get really big and thus making it hard to find the right items (even if you can use the search for dimension items option in analytic workspace). But if you really want to use this table throughout the organization, I recommend to create more than one “naming” classification. Maybe something like this:
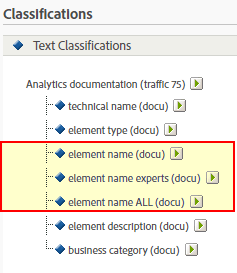
I marked the original “element name” classification and those for “experts” / “all”. This allows to create different tables based on the user knowledge. The classification file now contains some more items and different classifications for the name based on the user level. The classification file might look something like this (first few rows):

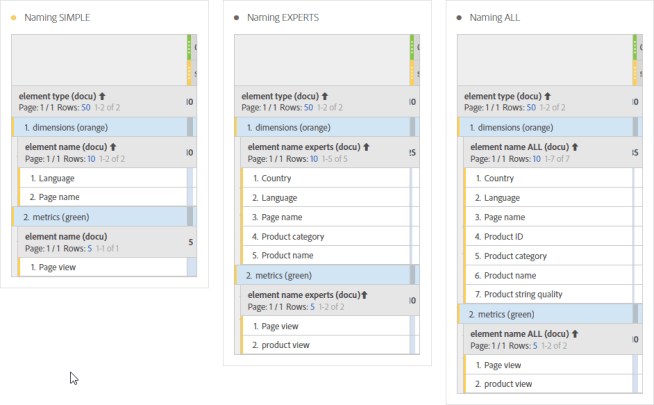
Have a closer look at the classifications marked green and blue (~empty~ does delete a single classification value just in case there has been set a value earlier). Now you can create the three different tables for your end users just as the knowledge grows throughout your organization. Give a simple table to beginners, and the other get either the “experts” or “all” table. Here’s an example for a single product hit with the three different tables based on knowledge:
And that’s all. You have your final tables for every single project within your organisation. Whatever data the analyst is looking at, the table will show those dimension and metrics which collected data on the single hits.
Bonus: Use participation
While working on a project you might be interested not only in the variables (props/eVars) that have been set on the corresponding pages, but also what happened before (persistent data). Just imagine you are looking at the product pages you could analyse if an user had searched on your search page or if an user had clicked a marketing banner on the homepage. What if you could create a table not only showing the “direct data” but also data fetched during customer journeys before the product page? something like this:

In the setup above you wouldn’t see those variables, since most likely they are outside of your project. Just an example: the user performed a search on your page about a product and hit on a result, leading to the product page. Only looking at the product page would not show any “search” dimensions or events. But luckily there is a nice solution “attribution modelling”!
First, I recommend to add a specific event for the documentation string. You could do this by adding a processing rule and set the event on every hit, just like this:

You can set a condition to check if the documentation prop exists, but since you want the documentation on any hit I recommend to leave it as is. However, you have now a separate event for a generic “documentation table” where you can turn on participation.
Next, we need to mark eVars that have a “visit scope”, since only those eVars keep the value until the data within your project. Imagine an internal search where you both set a prop and an eVar (with visit scope) on the search result page. Only the eVar would keep the value until any pages later on. That means we need to separate those “visit-eVars” from the prop. An easy way to do this is just adding a new classification to our documentation prop, called “data scope”:

Having the additional classification we need to update the classification file and insert the new row as well as adding the “visit” string to the desired eVars. Here’s an extract of the example file with the new visit scope indication:
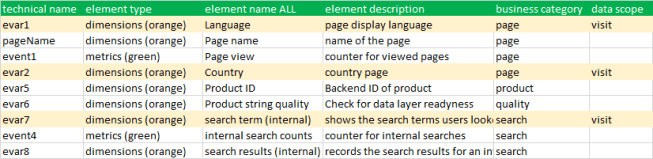
As you can see, I marked the eVars in this example as “visit scope” while some eVars are left blank in the last column. After uploading the new file and waiting for data processing I can now create the new tables. Starting with the documentation table for the “product page”, I change the event to use a non-default attribution model (use gear icon when hoovering over the green metric field). Just change to “linear” and set “lookback window” to “visit” (see picture below).
And to only show the desired items you also need to use the dimension “visit” which are set for just a few eVars. Select the dimension and add it to the same column, which will filter the items to just show the “visit scope eVars”. Here is the table with both “hit attribution” (left) and the new “linear visit attribution” (right).

Now the table shows those “persistent eVars” that have data set before the user entered the pages (marked red at the end of the table). And since those eVars can be used for reporting as well (they keep their value), you are now able to see more dimensions (or events for making segments) and add it to your project tables!
You could even improve this table by using two custom calculated metrics. “Direct Data” is a calculated metric to check if the “documentation event” is greater than 0 (equals “containing data”) and to display 1 or 0 (zero).
“Persistent Data” is a calculated metric where you check if the linear attribution is higher than the documentation event itself. If yes, there must be persistent data (due to linear attribution) and the metric display a 1.
Last step to the final table is changing row settings to “Interpret zero as no value” and turn on “conditional formatting”. The picture below shows the final table as well as all calculated metrics as column headers.

Bonus: other use cases for the “documentation event”
During setup for the “participation” I recommended to not set any condition when setting the “documentation event”. That means the documentation event gets set on every single hit, regardless any other data. Having this setup you can do the following:
- Check for missing documentation prop: Add an easy check to see if the documentation is missing somewhere. Setup a hit-segment with “documentation event equals 1” and “prop does not exist” and you get all hits where the documentation prop is still missing!
- Use event as server call counter: Since every hit gets marked by this event, you can use it as a counter for your server calls
Let me know any ideas you have to improve the solution or what other use cases you can think of having the new documentation prop. And I hope you can use it as much as I can in daily business.

Great presentation on Wed Urs and thank you for sharing such a detailed post.
I tried to vote for you to win but the Summit app wouldn’t open the survey.
LikeLike